Lesson reading
live
14 min
Start with the lesson question, connect the representations, and test the model with evidence.
Inspect the opening phenomenon
Predict what changes, then name the evidence.
Apply in the lab
Name the evidence before reading the answer.
Read only what helps
Then use the lab and recall check.
More when needed
Transcript and resources stay available below.
Course progress
Evidence, Models, and Periodic Properties
Decision challenge
Use the opening example to make a prediction, identify evidence, and explain which model supports it.
Predict whether chlorine's average atomic mass is closer to 35 or 37 from the peak sizes.
Use chlorine isotope evidence to explain why periodic-table atomic mass is a weighted sample average.
Before
Predict whether chlorine's average atomic mass is closer to 35 or 37 from the peak sizes.
During
Track how each fractional abundance contributes to the weighted mean.
After
Explain how increasing the chlorine-37 abundance changes the spectrum and average mass.
Lesson reading
live
14 min
Video script
draft
Transcript fallback
available
courses/ap-chemistry/modules/01-atomic-structure-and-properties/lessons/01-evidence-models-and-periodic-properties/video-transcript.md
Isotope Abundance from a Model Mass Spectrum
draft
1 hr 15 min
Mastery check
live
6 questions / 15 min
Chlorine atoms do not contain thirty-five point four five nucleons. So why does the periodic table show thirty-five point four five? A mass spectrum reveals isotope populations. Chlorine has a large peak near mass thirty-five and a smaller peak near thirty-seven. Convert each percent abundance to a fraction. Multiply each isotope mass by its fractional abundance, then add. About seventy-five point eight percent times thirty-five, plus twenty-four point two percent times thirty-seven, gives roughly thirty-five point five atomic mass units. The decimal is not one strange atom. It is the weighted average for a sample containing many atoms. Quick check: if the thirty-seven peak grew larger, would the average move up or down? Up—toward thirty-seven. Connect evidence, particles, and calculations in the full free AP Chemistry lesson at EduQuest AI.
Reading lab
Connect the lesson's words, diagrams, graphs, evidence, and equations.
How can measurements we cannot see directly reveal the structure of an atom?
A mass spectrometer reports two chlorine isotope peaks: about 75.8% at mass number 35 and 24.2% at mass number 37. The periodic table reports 35.45—not a mass number for one chlorine atom, but a weighted mean for a naturally occurring sample.
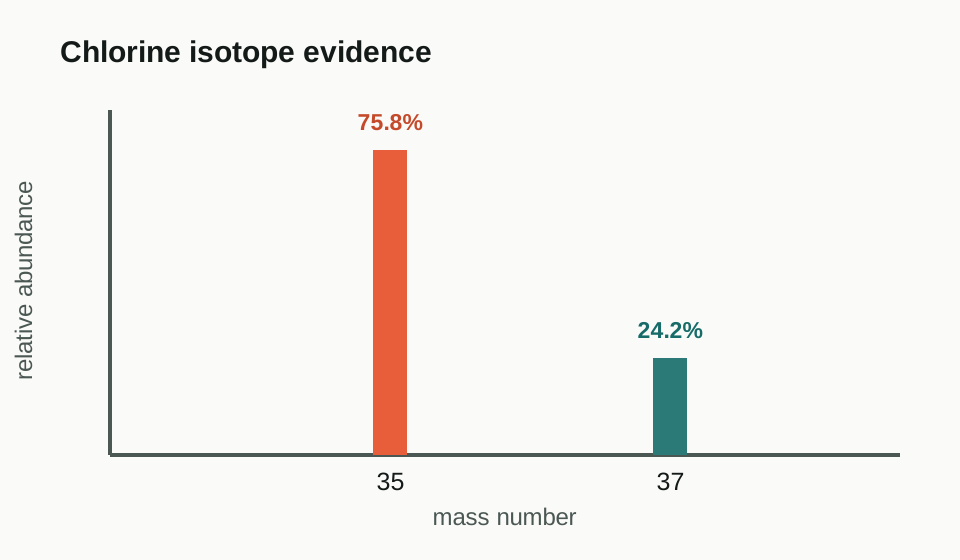
Three representations must agree:
Isotopes of an element have the same atomic number but different mass numbers :
For isotope masses and fractional abundances ,
Using simplified mass numbers for chlorine,
The result lies between 35 u and 37 u and closer to 35 u, as the spectrum requires. Using precise isotope masses produces the tabulated value near 35.45 u.
Electron configuration is a model for distributing electrons among subshells. For sodium,
Photoelectron spectroscopy (PES) measures the energy needed to remove electrons. A peak's position reflects binding energy; its relative area or intensity reflects how many electrons occupy that subshell under the stated plotting convention.
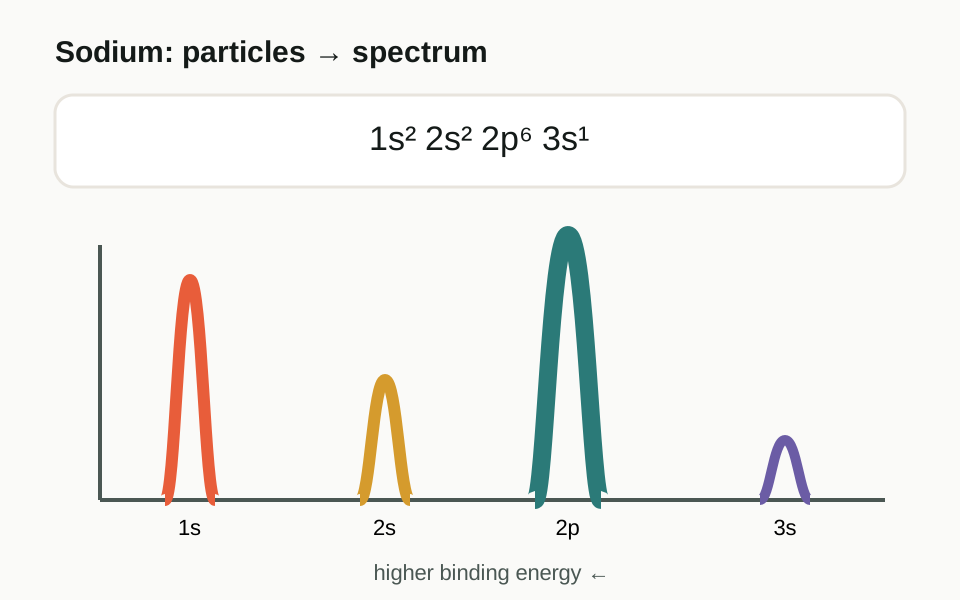
Core electrons have greater binding energy because they are, on average, closer to the nucleus and less shielded. Always read the axis direction: some PES plots place greater binding energy to the left.
Across a period, proton number increases while valence electrons enter the same principal energy level. Shielding does not increase enough to cancel the stronger nuclear attraction, so effective nuclear charge generally increases.
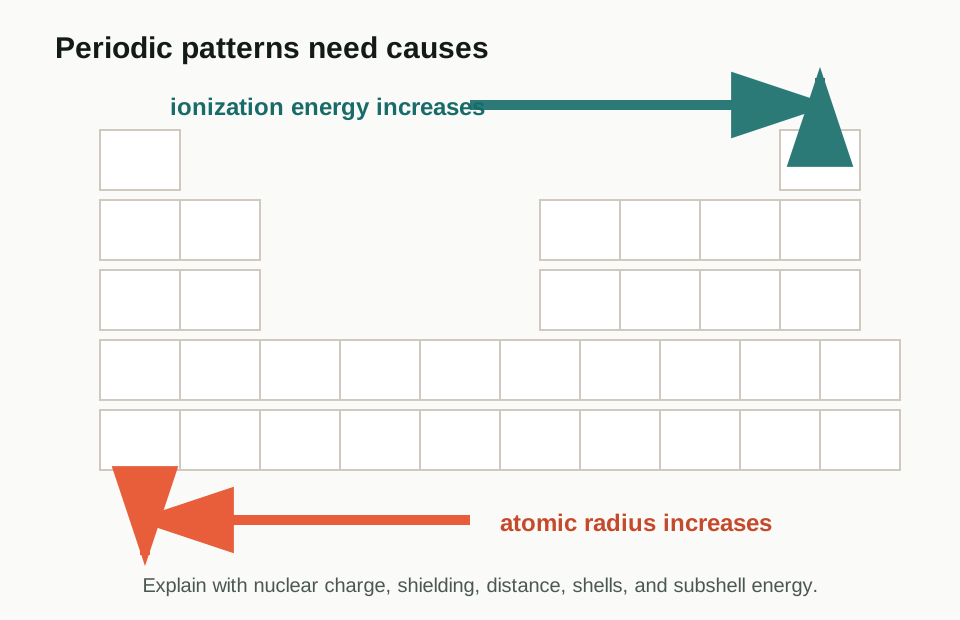
These are evidence-based patterns, not arrows to memorize. Explain each comparison using nuclear charge, shielding, distance, and electron configuration.
Magnesium ends in ; aluminum ends in . Although aluminum has greater nuclear charge, its first removed electron occupies the higher-energy subshell. Aluminum therefore has a slightly lower first ionization energy than magnesium. A good explanation identifies both the general trend and the subshell exception.
“Atomic mass is the mass number of every atom.” Atomic mass is a sample-weighted mean; individual atoms have particular isotope masses.
“Electrons orbit like planets.” Orbitals describe probability distributions and allowed energies, not fixed classical paths.
“Periodic trends are caused by more protons alone.” Attraction depends on nuclear charge, shielding, distance, and electron configuration.
Atomic models earn their value by explaining evidence. A defensible answer connects the measured pattern, a particulate structure, and a symbolic or quantitative model.
How reliably can peak intensities determine the composition and average mass of a two-isotope sample?
This is a supervised dry-data investigation with no chemicals. Use school-approved computers or printed spectra. Keep food and drink away from equipment, maintain clear walkways, and follow local electrical and accessibility procedures. No chemical waste is produced. A printed dataset and calculator provide a low-technology alternative.
The learner retains raw data, normalized fractions, sample calculations with units, uncertainty bounds, graph annotations, and a claim-evidence-reasoning conclusion. The mean lies between the isotope masses and shifts toward the more abundant isotope.
Design a method for estimating a three-isotope sample with partially overlapping peaks. State the additional assumptions or measurements required.