Lesson reading
live
20 min
Start with the lesson question, connect the representations, and test the model with evidence.
Inspect the opening phenomenon
Predict what changes, then name the evidence.
Apply in the lab
Name the evidence before reading the answer.
Read only what helps
Then use the lab and recall check.
More when needed
Transcript and resources stay available below.
Course progress
System Energy and Work Models
Decision challenge
Use the opening example to make a prediction, identify evidence, and explain which model supports it.
Draw a boundary around the cart, ramp, and Earth. Predict which energy stores change as the cart descends a rough ramp.
Predict whether energy disappeared, follow the 60-joule energy account, and answer the system-boundary retrieval check.
Before
Draw a boundary around the cart, ramp, and Earth. Predict which energy stores change as the cart descends a rough ramp.
During
Pause at the 60-joule account. If 15 joules become thermal energy, calculate the kinetic energy before the video reveals it.
After
Explain why gravity is external work for a cart-only system but gravitational potential energy for a cart-and-Earth system.
Lesson reading
live
20 min
Video script
draft
Transcript fallback
available
courses/ap-physics-1/modules/03-work-energy-and-power/lessons/01-system-energy-and-work-models/video-transcript.md
Track Energy Through a Ramp System
draft
1 hr 30 min
Mastery check
live
6 questions / 15 min
# Accessible transcript: Where Did the Energy Go? A cart slows from friction. Did its energy disappear? No—your system accounting is incomplete. Choose the system first. Then compare energy stores at the initial and final states, and track every transfer across the boundary. A two-kilogram cart drops three meters. That starts with about sixty joules of gravitational energy. If fifteen joules become thermal, forty-five joules remain kinetic. Set forty-five equal to one-half m v squared. The bottom speed is about six point seven meters per second. Quick check: if the cart alone is your system, do you count gravity as external work or gravitational potential energy? External work. Put Earth inside, and it becomes potential energy. Master system choice free at EduQuest AI. ## Visual descriptions The video shows a cart descending a ramp and places a boundary around the cart, ramp, and Earth. An initial 60-joule gravitational-potential-energy bar becomes a 45-joule kinetic-energy bar and a 15-joule thermal-energy bar, preserving total energy. It then displays the equation $45=\frac12(2)v^2$ and the result $v\approx6.7\text{ m/s}$. A final prompt contrasts gravity as external work for a cart-only system with gravitational potential energy for a cart–Earth system.
Reading lab
Connect the lesson's words, diagrams, graphs, evidence, and equations.
When is an energy model more useful than a force-and-motion model?
A skateboarder starts from rest at the top of a smooth ramp. You could track forces and acceleration at every location. Or you could compare the energy at the top and bottom. The second path often ignores the complicated details between those states.
Energy reasoning follows a compact chain:
choose the system → choose initial and final states → inventory energy stores → identify transfers → test the accounting.
Use the short video as a retrieval tool, not as a replacement for the lesson.
Before watching: Draw a boundary around a cart, ramp, and Earth. Predict what happens to gravitational potential, kinetic, and thermal energy as the cart descends a rough ramp.
During watching: Pause when the 60-joule energy bar appears. Before the split is shown, decide how much kinetic energy remains if becomes thermal energy. At the system-choice prompt, explain why gravity is external work for a cart-only system but an internal potential-energy interaction for a cart–Earth system.
After watching: Recreate the energy bars without looking. Then solve and check whether the result has reasonable units and magnitude. Use the accessible transcript if video or audio is unavailable.
Energy belongs to a defined system, not to a diagram by itself. If the system is a cart alone, Earth's gravitational force can transfer energy by doing external work. If the system is cart plus Earth, gravitational potential energy is an internal store. Both descriptions can be correct; mixing them double-counts energy.
The general accounting model is
where includes the energy stores chosen for the system and is energy transferred across the boundary by external work. Thermal transfer or other mechanisms may be named separately when useful.
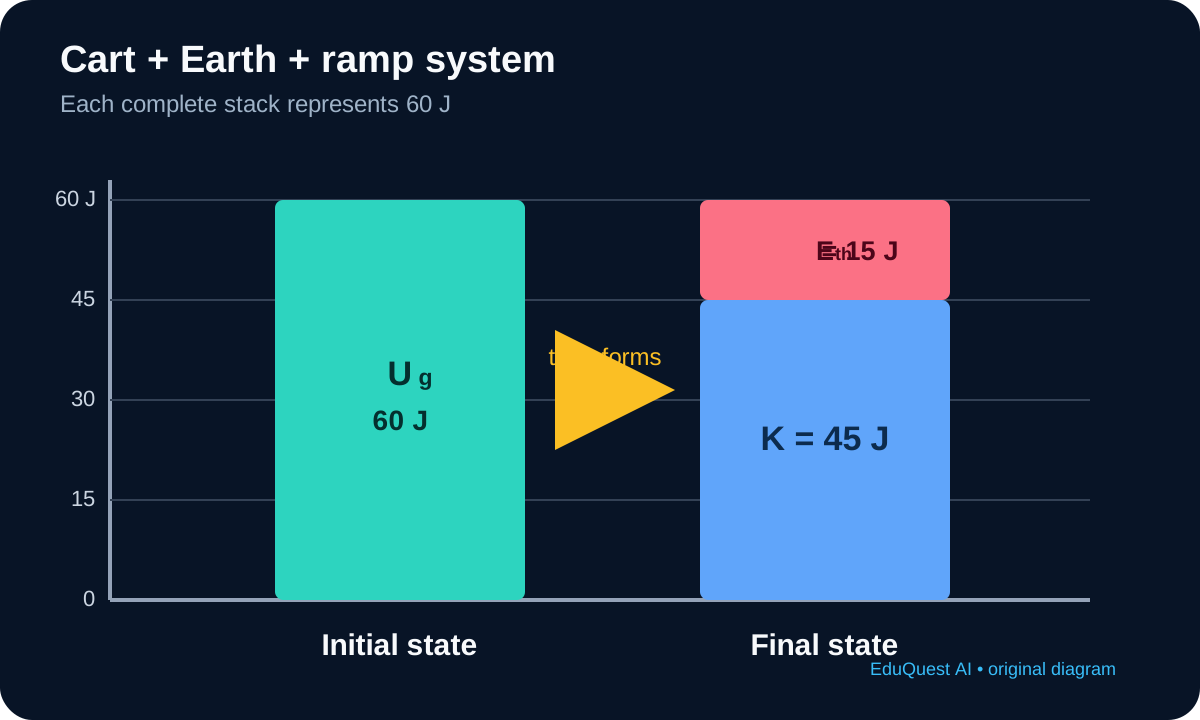
The chart's equivalent statement is: for a cart–Earth system on a nearly frictionless track, gravitational potential energy decreases while kinetic energy increases by the same amount.
For a constant force acting through displacement ,
Work is positive when the force component points with displacement, negative when it points opposite displacement, and zero when it is perpendicular. A force can act yet do zero work; for ideal uniform circular motion, the radial force is perpendicular to instantaneous displacement.
The net work on a particle-like object equals its change in kinetic energy:
A cart moves at . A worker does of work on it while friction does . Find its final speed.
The net work is . Initially,
Thus , so
The worker's work is not the kinetic-energy change because friction also transfers energy.
Near Earth's surface, the change in gravitational potential energy of an object–Earth system is
For an ideal spring in the Hooke's-law range,
Only changes in potential energy matter, so the zero level is a convenient choice. The sign of depends on the change in height, not on the direction the object happens to move horizontally.
Energy is not “used up.” It transfers between objects or transforms among stores. If friction acts inside the chosen system, mechanical energy may become thermal energy:
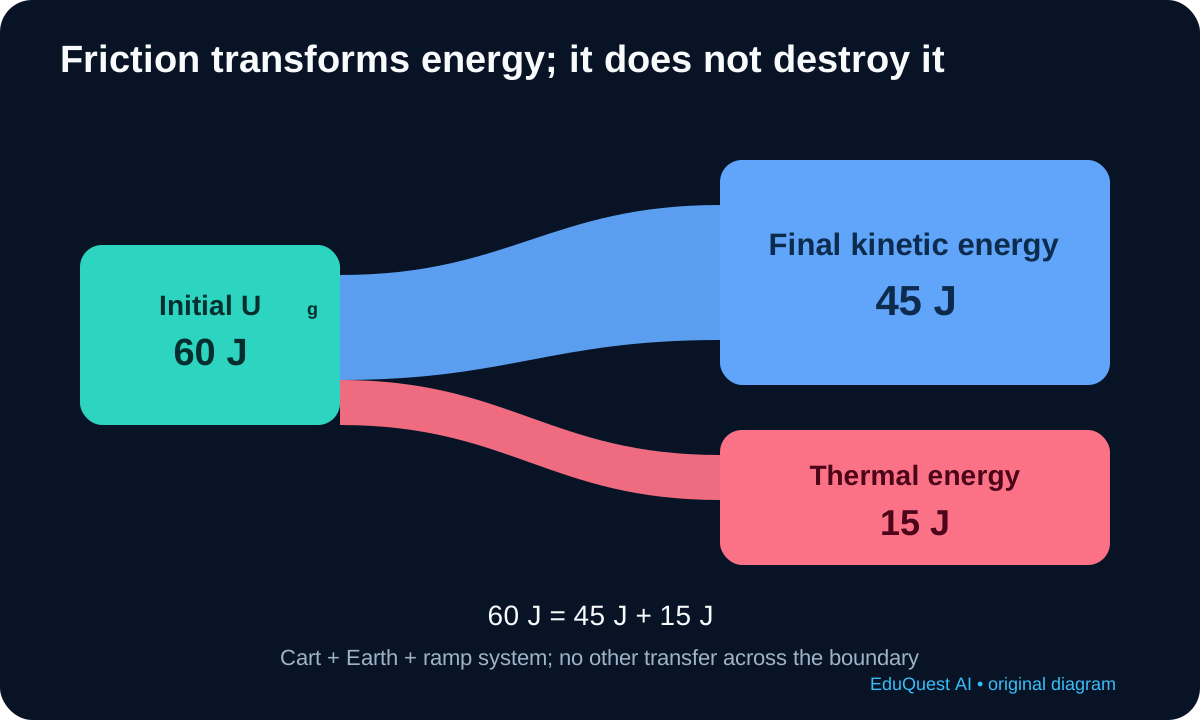
Equivalent text: a decrease in mechanical energy equals the increase in thermal energy when no energy crosses the system boundary by another pathway.
A bicycle and rider of total mass slow from to rest on level ground. For the bicycle–rider–road system, the increase in thermal energy is
The energy has not disappeared. It is distributed mainly as thermal energy in brakes, tires, road, and surroundings.
Average power is
For a force applied to an object moving with instantaneous velocity,
Power and energy are not interchangeable. Two motors may transfer the same energy, while the more powerful motor does so in less time.
For a conservative interaction, force relates to the slope of a potential-energy graph:
Where rises to the right, force points left. A stable equilibrium occurs at a local minimum of ; small displacements produce a force back toward equilibrium.
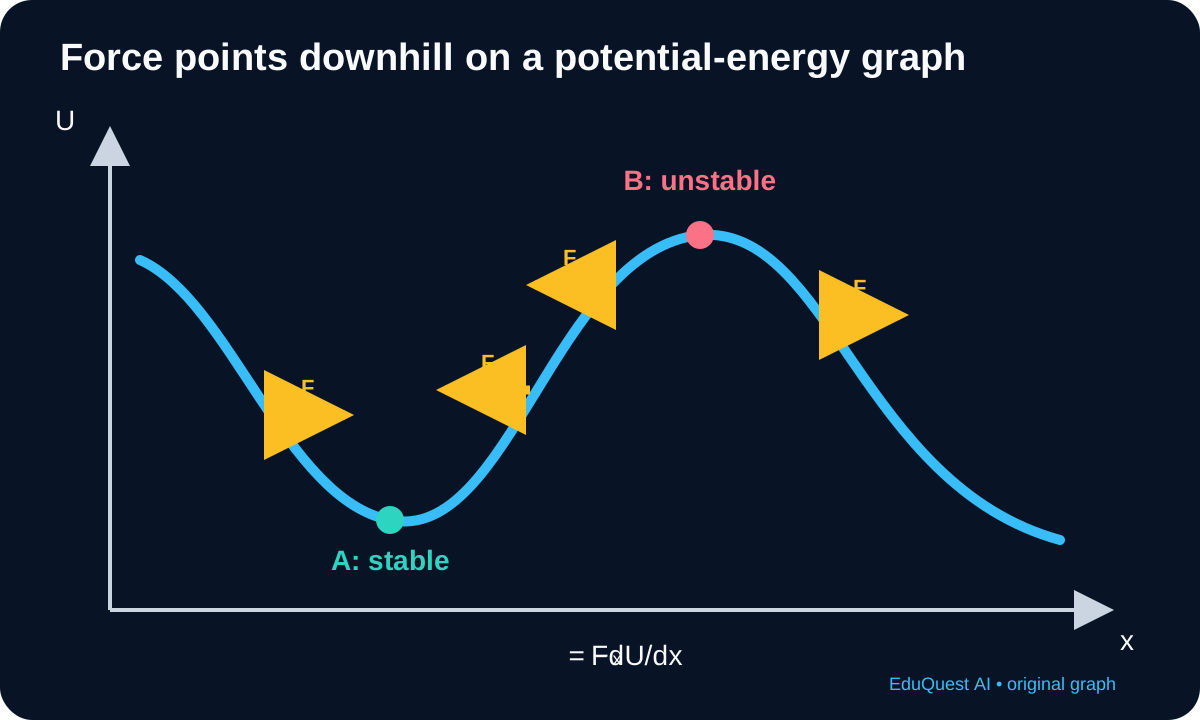
Equivalent text: the graph has a valley at point A, where nearby slopes direct force back toward A, and a hilltop at point B, where nearby forces direct the object away from B.
Use an energy model when the question compares states, path details are unnecessary, or force varies with position. Use Newton's laws when you need acceleration, time, direction changes, or individual interaction forces. Sometimes the strongest solution combines them: energy finds speed, then dynamics finds a force.
“Energy is consumed.” Energy transfers or transforms; useful mechanical energy may spread into thermal stores.
“Zero net work means no forces act.” Multiple forces may do work that sums to zero, or a force may be perpendicular to displacement.
“Potential energy belongs to one object.” It is associated with an interaction inside a chosen multi-object system.
“Power is energy.” Power is the rate at which energy is transferred.
Energy accounting connects states without reconstructing every instant. Its reliability depends on a clear system boundary, explicit transfers, and consistent treatment of potential and thermal energy.
How does the measured loss of gravitational potential energy compare with gains in kinetic and thermal energy for a cart descending a ramp?
Conduct this investigation under teacher or responsible-adult supervision. Secure the ramp, keep the cart path and floor clear, use a low release height, install a soft catch barrier, and keep hands away from moving wheels. Do not stand downhill from the cart. Stop if the track, cart, or timing equipment is damaged.
Low-cost alternative: toy car, rigid board, books used as a stable support, measuring tape, and phone video.
Simulation alternative: use a teacher-approved energy-skate or ramp simulation. Preserve the same variables and state which real dissipative effects are omitted.
Choose cart plus Earth plus ramp as the system. Predict
Independent variable: vertical release height. Dependent variables: speed near the bottom and calculated energy stores. Controls: cart, ramp geometry, release method, speed-measurement location, and surface condition.
Record trial, mass, height, height uncertainty, speed, speed uncertainty, , , and the difference .
The final kinetic energy should increase approximately linearly with lost gravitational potential energy. A slope below one, nonzero intercept, or systematic residuals should be explained using thermal transfer, rolling resistance, measurement uncertainty, and model limits rather than described as missing energy.
Propagate or bound uncertainty consistently. Because depends on , explain why speed uncertainty can strongly influence energy uncertainty. Distinguish random timing scatter from systematic height, calibration, rolling-resistance, or release errors.
Make a specific claim about energy accounting. Cite fitted slope, uncertainty, and repeatability as evidence. Connect the evidence to the system model and explain deviations without claiming that energy vanished.
Use measured speed to calculate average power delivered to kinetic energy over the descent time. Explain why this is not necessarily the instantaneous power at the bottom.


